
“Tracking the adoption of a design system not only helps to unify and streamline the design process, but also enables teams to work more efficiently and effectively, leading to a better user experience.”
Measure the usage of the design system
Design system one of the trending frontend topics is a library of reusable components with defined guidelines that helps to maintain the consistency of the product. Measuring the usage of design systems is one of the newest challenges in the industry. Tracking the extent of adoption of your design system helps measure its success. It also helps to identify areas of improvement within it. There are various methods to track design system adoption such as:
- Collecting usage data, which provides quantitative metrics for tracking. Some metrics that are used for tracking include:
- The number of users accessing the design system.
- The number of components used in different projects.
- Frequency of components used in different projects.
- The version of packages used across various projects.
- Conducting surveys can be a helpful way to gather feedback from users about the design system and its adoption. One can use surveys to ask users about their experiences with the design system, what they like and don’t like about it, and any challenges they have encountered.
- Monitoring adoption rates is another way to track the adoption of a design system. This could include tracking the number of new users adopting the design system over time, or the percentage of projects that are using the design system.
- Seeking feedback from stakeholders can also help in gathering the details from stakeholders(design and development teams) to get a sense of how the design system is being adopted within our organization.
Let us give you some insights into how we at Sendinblue are keeping track of the adoption of our design systems (Indigo).
Tracking Indigo Adoption
How did it start?
Once our journey with the Indigo design system started, multiple projects within our organization started adopting its components. Within a year, more than 25 projects within Sendinblue were using indigo. Due to this widespread adoption, we decided to track the extent of adoption at our end. This tracking not only helped us demonstrate the value of our design system to stakeholders but also helped us in measuring its success and identifying the areas of improvement. The process which looks straightforward has some challenges associated with it.
Overcoming the challenges?
To measure adoption, it’s important to collect usage data and monitor adoption rates across various projects. However, this can be challenging. One issue is a lack of clear metrics to define and track adoption. Considering our requirements we brainstormed and decided to track the following:
- Number of projects accessing the design system,
- Number of components and frequency of use in each project.
- The version of packages being used.
- And the ratio of Indigo components to old frontend component library components.
Limited data and complexity can also make tracking adoption difficult, especially in organizations with multiple teams and projects. To address these issues, we defined an automated tracking mechanism at Sendinblue which reads the project repositories and records the component used in each project.
Architecture, tools, and process of adoption tracker
Architecture:
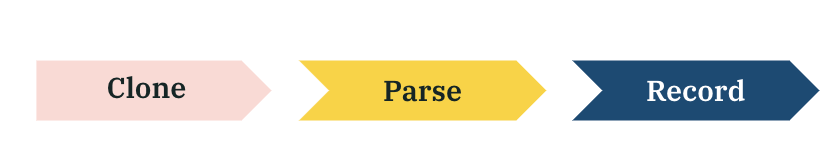
Multiple projects have adopted Indigo within the company. To track the extent of Indigo design system adoption at Sendinblue, we clone each project and parse their codebases to identify component usage. We recorded this data for further analysis.
Tool used:
We used the following tools for our tracking:
- React scanner: this is a valuable tool that allows you to scan the react codebase. It provides us with useful features, such as the ability to visualize your component tree.
- GitHub Actions is a continuous integration and delivery (CI/CD) platform. It allows us to automate our workflow. It allows us to build, test, and deploy our code right from GitHub.
- Metabase is an open-source business intelligence platform that allows users to easily visualize and analyze data. It accepts a variety of sources which makes it simpler to integrate. It provides a simple, intuitive interface, which helps even non-technical users to explore and understand their data.
Automating the process:
Tracking design system adoption can be difficult, especially across multiple repositories and teams. So to simplify this process, we developed an automated tool. The tool runs a batch job monthly to process and store the data in the Metabase.
We used GitHub action and node js to write this automation script. Our GitHub action is a cron job scheduler that runs our node js script periodically. We have divided our workflow into four jobs:
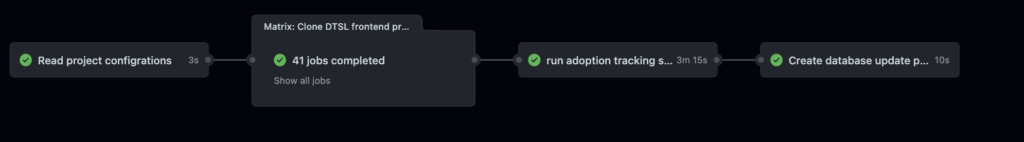
- Firstly, we store the details of all frontend repositories in our organization into an output variable called a matrix.
- Then we clone all these repositories using the GitHub action strategy. We do this by running a matrix job that clones every project. Once completed then we upload this project into the GitHub artifacts. This process runs asynchronously for all the projects to save time.
- We download the above GitHub artifacts into a single folder. We used react-scanner to parse that particular folder and generate the reports. After parsing we record this result in our GitHub repository.
- After generating these reports, we push this data into the metabase using Prisma.
Hence with the help of Metabase, we are able to further analyze this data to measure the extent of adoption of the design system in various projects within Sendinblue. The analysis helped us record some measurable results described below.
Measurable Results
With our tracking efforts, we are able to record a number of key metrics that helped us understand the extent of the adoption of our design system. We were able to record valuable insights, such as:
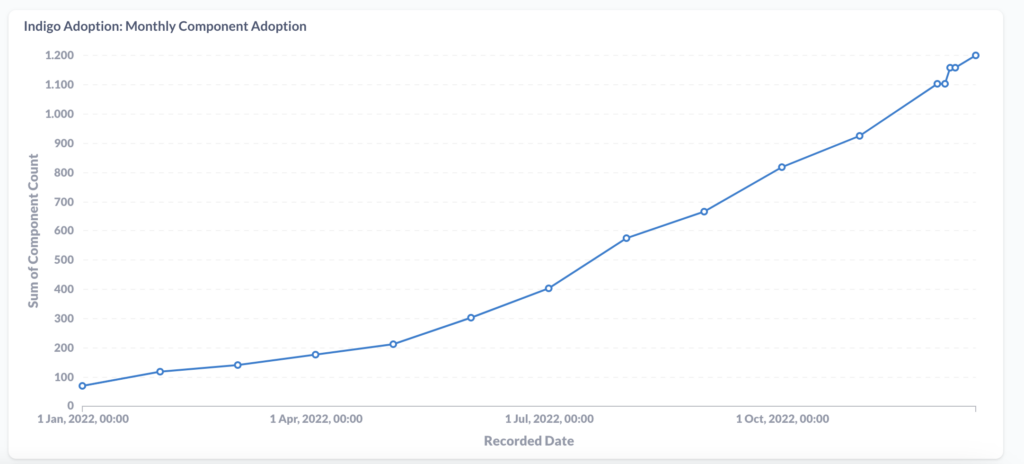
- One of the primary metrics tracked is the total instance of indigo components used across organizations. This helped us track the progress of indigo usage throughout the organization.
- The second parameter tracked is the number of different components each project uses.
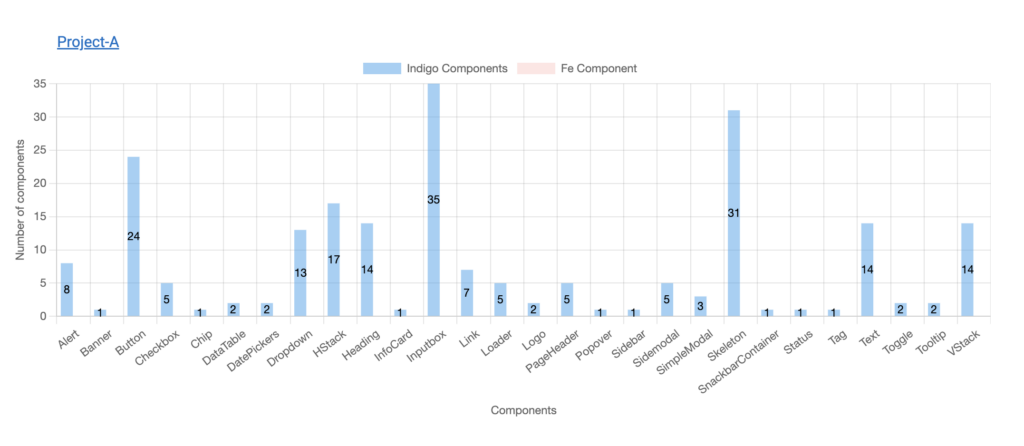
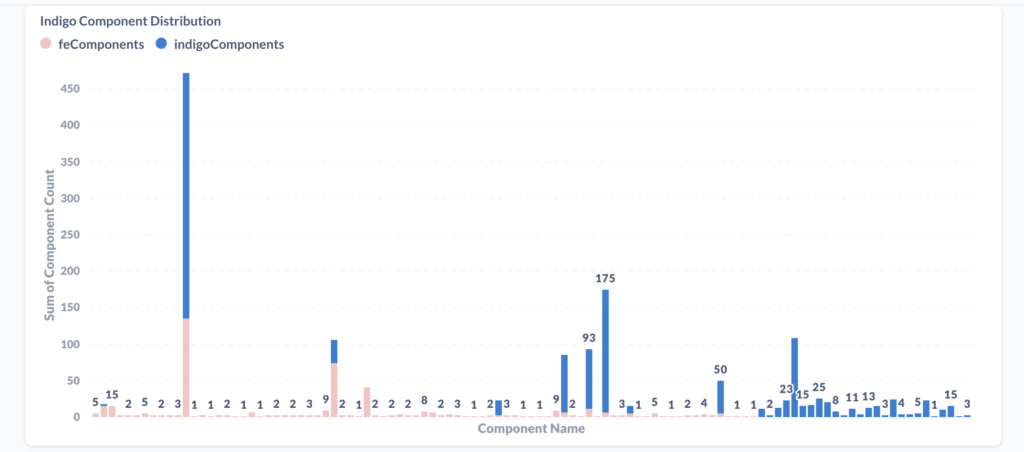
- We are tracking the types of components being used in each project. This tells us about the most popular components. It also tells us about the underutilized components. By understanding the usage we can prioritize updates and improvements to each component.
- We are lastly recoding the version of packages being used in each project. This helps us ensure that all projects are using the most up-to-date version of our design system. It also helps us identify projects that may be using outdated versions.
Overall, tracking the adoption of our design system has provided valuable insights into how it is being used. It also helped us identify the areas we can make improvements. By understanding the metrics presented above, we can make informed decisions about how to evolve and improve our design system over time.
Conclusion
Tracking the adoption of a design system within an organization is undoubtedly a challenging task, especially if you have multiple repositories and teams working on different projects.
We made this process easier, by developing a tool that automates the process of tracking design system adoption. We clone each repository and parse the codebase using this tool. Then we record the instance of the indigo component used in each project twice a month and store this data in the Metabase for further analysis. Hence we are able to track the adoption of our design system on a real-time basis.
We can see which components are used most often and which ones are being ignored. It also helps us track the version of the design system used by each project.
Overall, our tool helps us ensure that our design system is being adopted consistently across all of our projects and teams. By tracking the adoption of our design system, altogether we can make informed decisions about how to improve our design systems and correspondingly how it is evolving over time.
Resources
https://www.npmjs.com/package/react-scanner
https://github.com/features/actions
https://docs.github.com/en/actions/using-jobs/using-a-matrix-for-your-jobs