When it comes to user experience, nothing is more likely to drive users away than a poorly performing application.
Performance is the key to successful user retention, and it gives users a positive feeling of moving quickly toward their goals. With internet speed increasing day by day users expects a web page to load fast. The second delay in page load will decrease customer satisfaction and brand value and even lead to revenue loss.
Google started emphasizing the importance of Core Web Vitals and lighthouse performance, and how they impact the real experience of users. We at Sendinblue have made performance a core feature of our product.
The Opportunity
At the start of the year, all the engineering verticals of Sendinblue come together and define a tech roadmap plan for a year, and mostly we set targets for ourselves to adopt new technologies as well as reduce the tech debt. It was the perfect opportunity to improve lighthouse performance and serve a better user experience.
Talking about opportunity, the lighthouse tool in the chrome browser provides detailed analysis, it records how long the page takes to hit various performance milestones. These milestones are called metrics. The report provides a score for each lighthouse metric and a list of opportunities to improve them.
Measuring the success metric of lighthouse performance
So this is where we start measuring the impact of performance metrics to improve user experience. First of all, we set a target lighthouse performance score of 90 for all pages. It was a tough target given when we started auditing the performance of heavy traffic pages(routes), the average lighthouse performance score was 69.
After 6 months we have achieved the following:
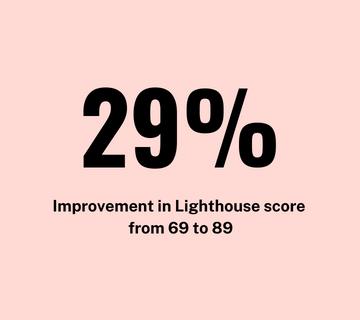
- 29% average lighthouse performance improvement from 69 to 89, this activity was done on ~40 pages, out of which 88% pages were from monolith applications.
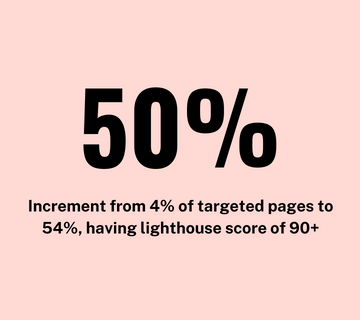
- 50% increment achieved, initially it was only 4% of targeted pages having an average lighthouse score of 90+ versus now it’s 54%.
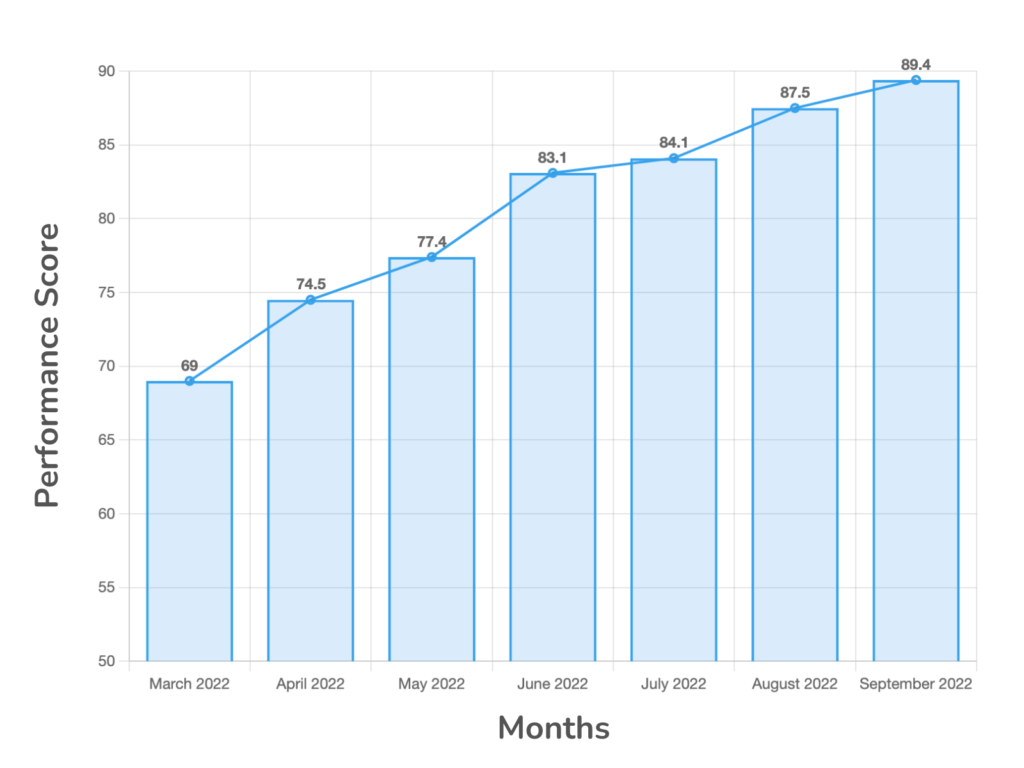
Refer to the below visualization which represents month-by-month progress.
Lighthouse score by month
The challenge
At Sendinblue we have more than 40+ front-end applications, out of which 10+ applications are a monolith and 30+ are single-page applications.
One of the biggest challenges was to improve the performance of monolith apps. No matter how much an organization adopts a new tech stack, there are always legacy applications where improving performance is a tough task given we are getting thousands and millions of live user traffic (for example landing route after login is getting 0.7 million traffic per week and 3 million traffic per month) and one wrong change will impact their businesses and our business.
The major challenge in improving single-page applications(SPA) performance was:
- Organize/optimize the code in such a way so that on the first load it only downloads and renders the code which is required, to improve the FCP.
- Load all the javascript chunks in parallel, so that we unblock the render of the application.
- Try to load the largest content as early as possible so that it can improve the LCP of the application.
The approach
We decided to pick routes based on high traffic and low-performance metric score. Our primary target was to reduce these four lighthouse metrics as it covers 80% of weightage as per Lighthouse 8 score metric.
- FCP (10%)
- LCP (25%)
- TBT (30%)
- CLS (15%)
Note: Above weightage is as per the Lighthouse 8 Scoring Calculator.
We have set targets for each metric as below:
- FCP (1.8s)
- LCP (2.5s)
- TBT (200ms)
- CLS (0.1)
Talking about user experience in terms of data:
- Currently, a good target for the first load of the page is under 5 seconds in a slow 3G connection (this doesn’t mean loading everything under 5 seconds, load the important part in 5s and differ the other parts, using lazy-loading images which are not in the viewport, code-splitting javascript bundles, etc)
- For subsequent loads, it should be 2 seconds.
- Respond to user input in under 100ms.
- The site should be rendered in 60 frames per second (fps) for smooth transitions across the screen.
Key resource optimization to improve lighthouse performance
- Reduce render blocking and lazy load CSS not required for first paint.
- Lazy load CSS is not required.
- Deferred loading of non-critical JavaScript.
- Reduce and defer 3rd party JavaScript.
- Reduce DOM (document object model) size.
- Lazy-loaded below-the-fold images.
- Removed the blocking JS (such as language properties) files to reduce the TBT.
Let’s talk about 4 metrics FCP, LCP, TBT, and CLS:
How we improved first contentful paint (FCP)
First Contentful Paint is when the browser renders the first bit of content from the DOM, providing the first feedback to the user that the page is actually loading. Identifying and eliminating render-blocking resources is the first step to reducing FCP.
Reduced render-blocking resources
- Load critical CSS required for the first contentful paint and defer the rest of them.
- Inline styles that are required for the first paint.
- Inline critical javascript in
scripta tag on your HTML page. - Code that is critical to the page’s core functionality.
- Scripts that are not required at first-page load
asyncordeferthem. - Separate stylesheets categorized by the type of media they’re meant for (e.g., mobile, desktop, etc.).
How we improved the largest contentful paint (LCP)
The largest contentful paint has 2nd most weightage with 25% in lighthouse performance metric and one of three core web vital metrics and most relevant for improving user experience. Unlike FCP which gets captured at the initial loading of the page, LCP gets calculated once above the fold content of the page becomes visible to the user. If the page’s biggest element doesn’t load fast, then the user experience won’t be good.
Reduce resource load time to improve lighthouse performance
- Loading non-critical CSS/Fonts after page load.
- Delivering static resources faster with a content delivery network.
- Use of font-display: swap property to load the text in the best matching font, then switch to the original web font of the application.
- Lazy loading images with loading=”lazy” or use an image lazy load plugin for not supported browsers. See a list of browsers on this link.
- Reduced chunk size of pages by lazy loading all the code which is not required at first complete render.
- Reduced chunk size of pages.
- Used images in webP format.
- Use of Brotli compression over gzip.
How we improved Total Blocking Time (TBT)
Total blocking time is the single largest contributor with 30% weightage in the lighthouse performance metric. It is the amount of time during which long tasks block the main thread to prevent users from taking action on a page.
It calculates the total amount of time the page was blocked to user input. As Javascript is a single-threaded language, it is blocked from executing script delays user interaction time.
This is calculated by adding the blocking portion of all long tasks b/w FCP and Time to interactive. As per the Lighthouse calculator, a good TBT should be ranging from 0 to 200 ms.
- Reduced unused/unnecessary JS to load.
- Analyze main thread work to determine if it is doing necessary work for page load.
- Reduced JS payloads with code splitting.
- Optimize code in a way that reduces main thread work like event delegation, using specific and accurate selectors.
Why minimizing the main thread is important for TBT
Every browser has a renderer process that effectively transforms code into a page that can be used and interacted with. It’s in the main thread where most of this is processed. The main thread parses HTML and CSS to apply specified styles for the content. It also parses, evaluates, and executes JavaScript.
Think of the main thread as your local grocery store person. They are able to handle most of the day-to-day tasks in the shop — packing orders, billing orders, cash or card payment — but if they are busy when a customer tries to order an item, that customer is going to exit the shop — that means page. This is important because the main thread also processes user events.
So, if the main thread is occupied when a user interaction comes in, your web page will not respond to this interaction.
How we improved Cumulative Layout Shift (CLS)
Have you ever noticed sudden movement on a web page when you are about to click on a button or link and it moves to another place, voila! you end up clicking another action item or ends up clicking on the text or any other part of the page.
Cumulative layout shift has 15% of weightage in lighthouse metric and important core web vital metric as well, so below are the improvements:
- Used font-display property to prevent layout shifts.
- Used
<link rel=preload>on web fonts. - Use of skeletons loader for initial layout.
- Use explicit dimensions in all images to avoid extra paint.
Monitoring the lighthouse performance metrics
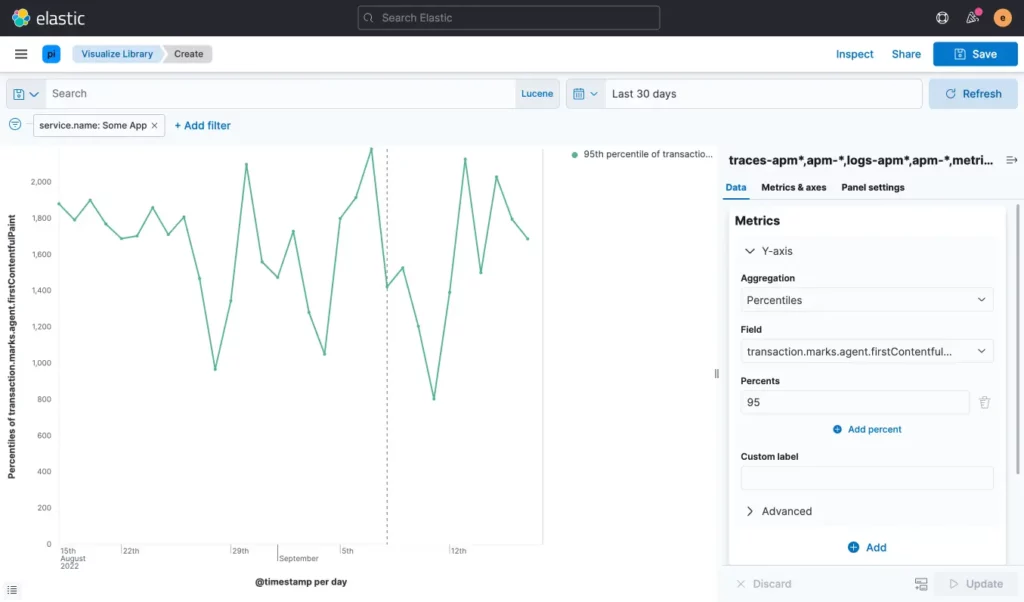
Monitoring is an important aspect to gather real user data and it reveals gaps and issues which need to be addressed. We have Elastic Real User Monitoring (RUM) set up in all the applications(monolith and SPA), which provides all relevant insights of core web vital metrics based on percentile values (P50 to 99) and page views over the period.
We are capturing lighthouse performance metric data from Elastic RUM as the Sendinblue application runs behind the login. Below are the key points that we followed in setting up monitoring:
Real User Monitoring (RUM)
We are using Elastic’s Real User Monitoring to capture user interaction, given RUM is based on a javascript agent it supports any application which runs javascript for interaction. This way we are getting all the necessary data inputs that help in identifying issues:
- Percentile (P50 to P99) data metrics over the defined period.
- The user experience dashboard provides data based on page load, core web vitals metrics, and visitor breakdown.
- Create visualization and compare latency over the period.

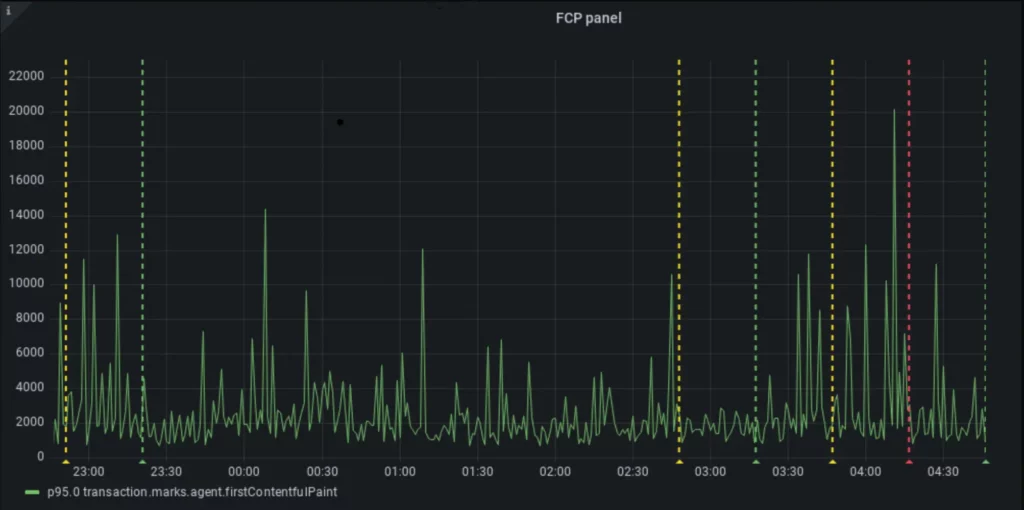
Grafana Alerts
Once performance changes are live on production, the next task was to ensure there is no regression over the period, otherwise, all the good work goes in vain. We have set up grafana alerts based on latency and subsequently created a slack webhook to get alerts for all applications. You can read more about grafana alerting on this link.
Happy learning!