Reliability of services especially in terms of availability and performance is a topic that every product organisation has to think about. It’s important to define quantitative metrics that can be in sync with the business objectives. It will eventually help in prioritising between feature delivery vs stability. Also, help in evaluating if the technical choices by engineering teams are helping in business vision or not. And that’s where we introduce SLO, SLI and SLA.
At Sendinblue, we aim to bring this visibility via the 3 related concepts namely
- Service Level Objective (SLO): It’s a quantitative value or a target that a service should aim to achieve to define the reliability needed to meet the business objectives. These are mainly internal goals with the main stakeholders being product engineering and SRE teams.
- Service Level Indicator (SLI): It’s a measurement of a service’s behaviour to visualise how the service is performing in a given time range. A service can have multiple SLI’s like latency, error rate, etc. Grouping of 1 or more SLI’s helps to define the SLO.
- Service Level Agreement (SLA): It’s an agreement between the client and the service owner to define policy for SLA breaches. Usually, SLA is more lenient than SLO. You might breach the SLO but will take steps to avoid breaching the SLA. The main stakeholders being sales and customers.
SLI
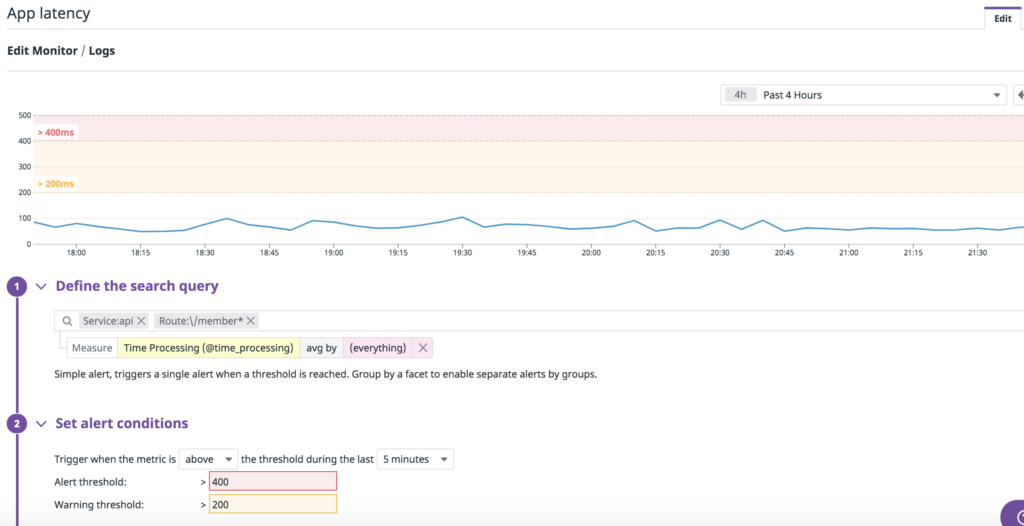
We have multiple monitors created on Datadog to define the SLI’s for our services primarily for availability and latency. For example
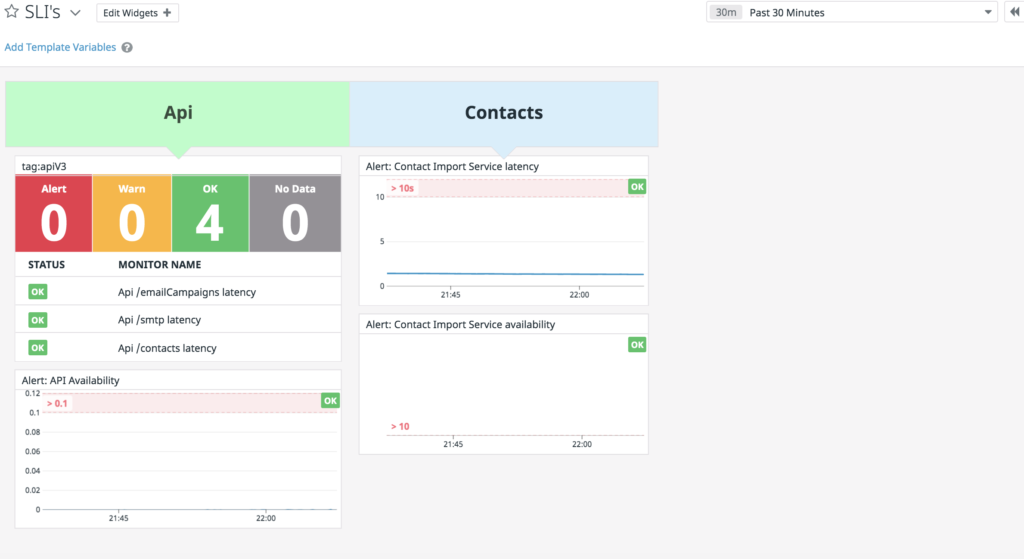
We have dashboards created having these monitors to represent an aggregated view of the SLI’s. For example
SLO
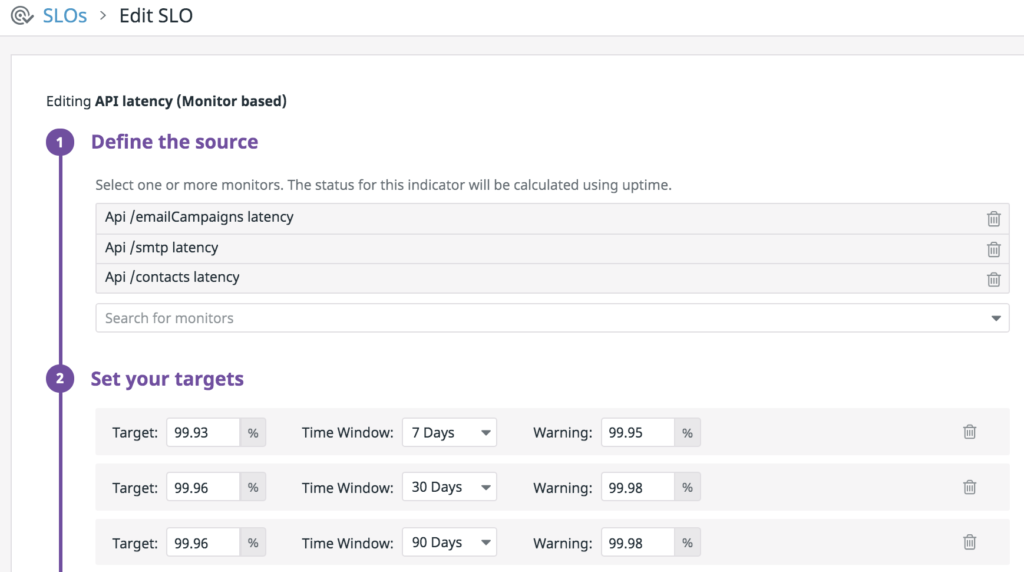
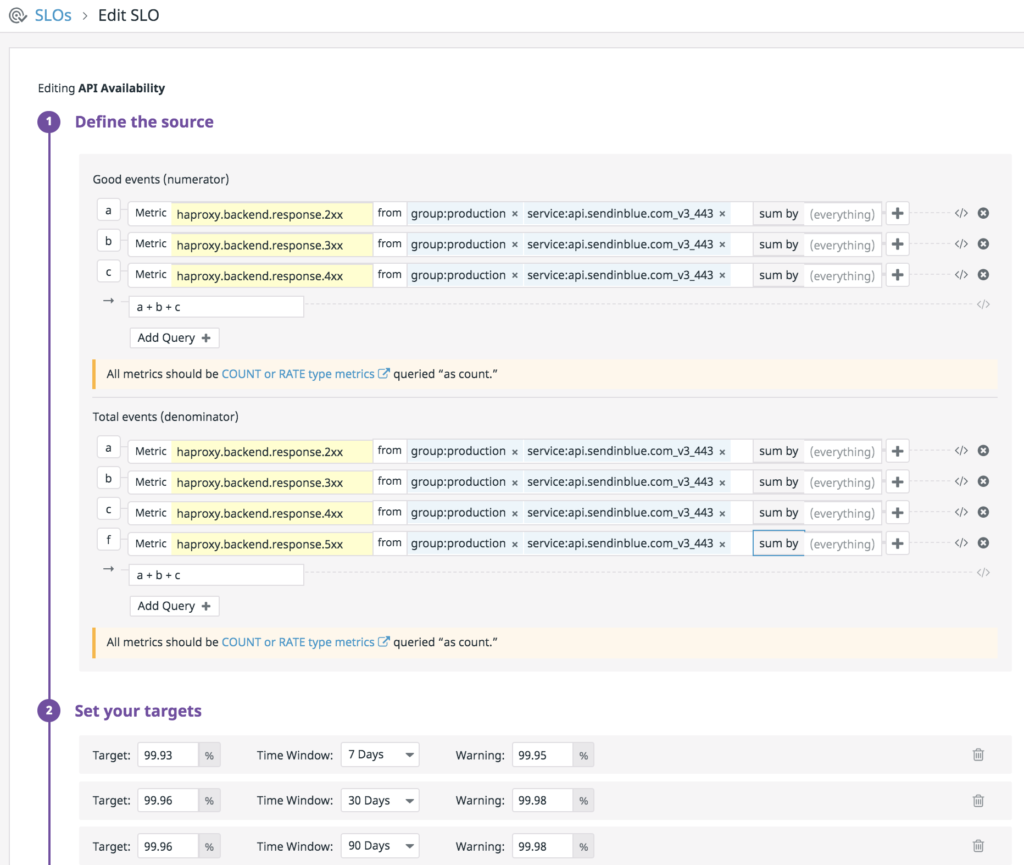
We create SLO’s for services based on monitor indicators or metric indicators. And we define the targets on a weekly, monthly and quarterly basis. Accordingly we create alerts on the breach of SLO. For example
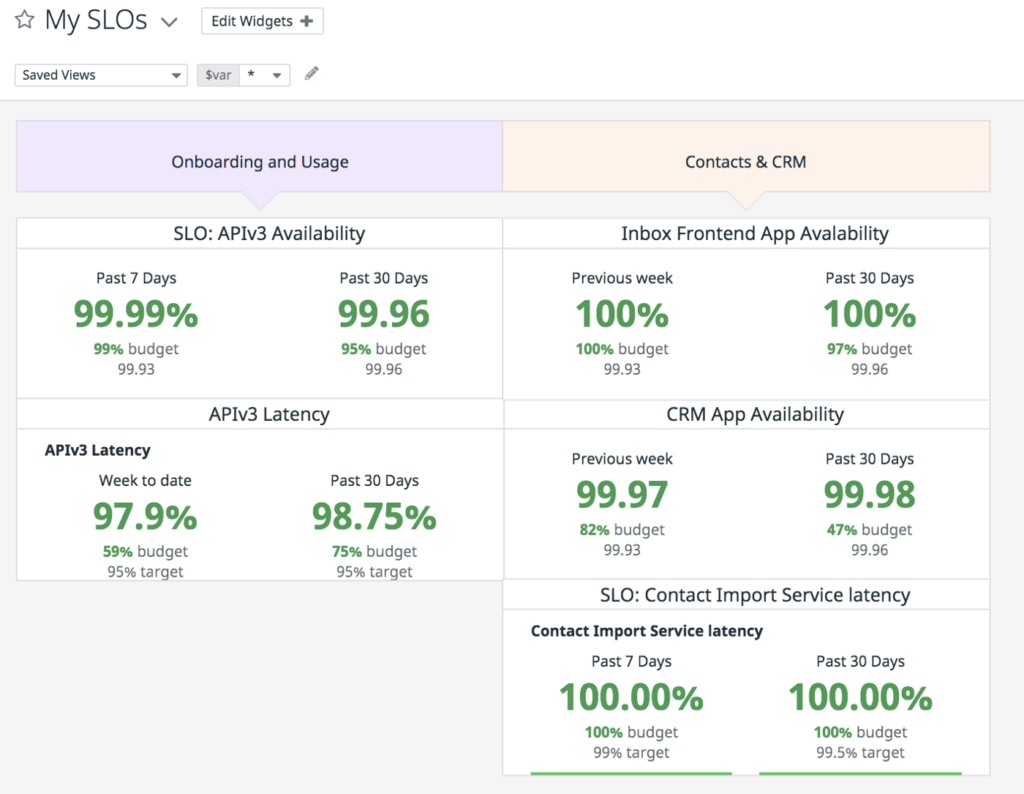
We have created SLO dashboard having multiple services SLO’s to view an aggregated view of all SLO’s corresponding services. For example
Error budget
For every SLO, we have the overall status percentage, target as well as the budget. The error budget gives a quantitative view of the unreliability that is observed in the service within a given timeframe.
Error budget consumed % = ((100 – Status %)*100)/(100 – SLO target %)
Budget % = 100 – Error budget consumed %
This metric has the main advantage to bring a balance between the time to be spent on new releases vs working on the reliability of the services. The timeframe in which the status % is above the SLO target % will ensure the error budget is left and the service is within accepted unreliability. Thus making the way for more new releases.
Conclusion
To sum up, this is how we aim to bring visibility into the reliability of services. With datadog and its vast integration with tools, it provides a great interface to define SLO, SLI and SLA. We are in-progress and continuously evolving our metrics. There’s still much to explore and I hope to bring more thoughts in the next post.